When Lines Split: Spotting and Exploiting Odds Discrepancies in Soccer Yellow Cards and NBA Assists
Paul Reed · Apr 3, 2026
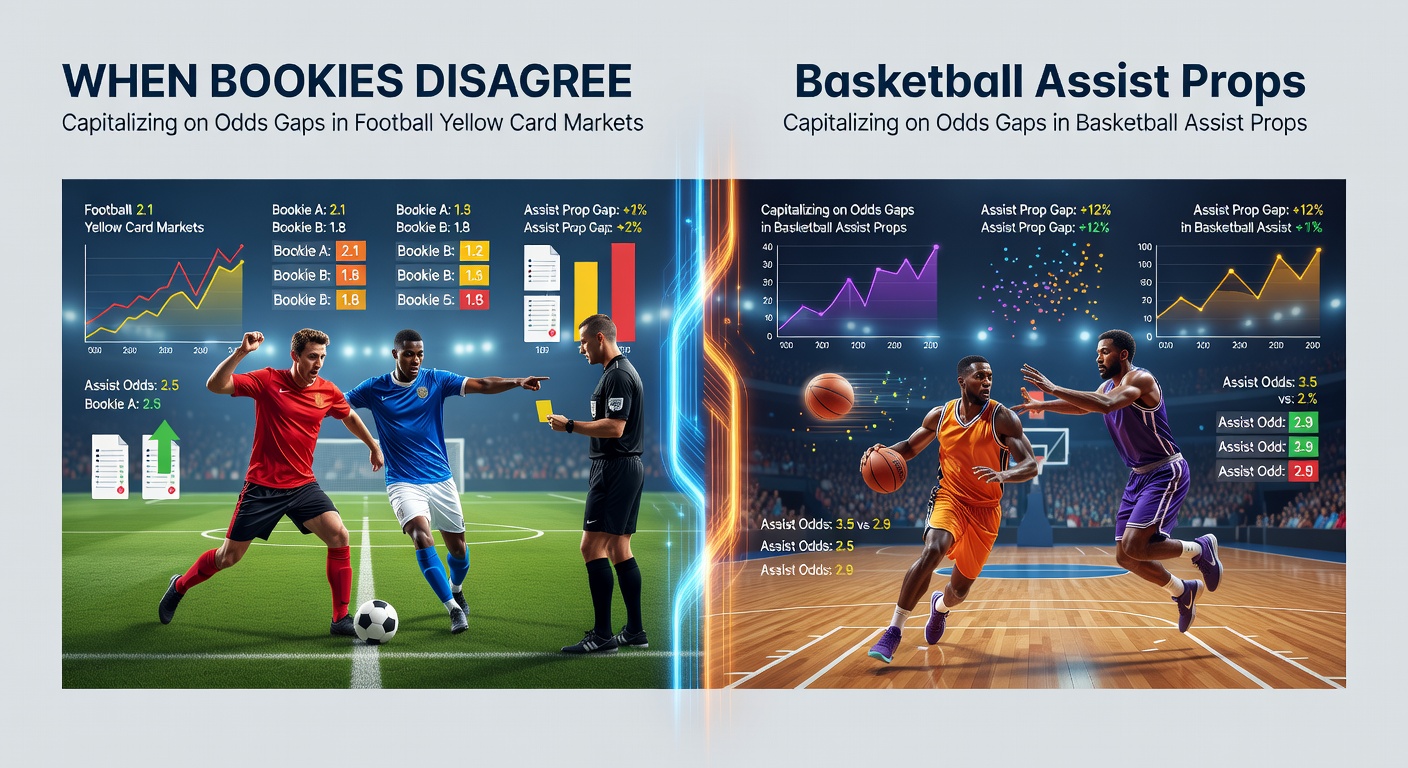
When Lines Split: Spotting and Exploiting Odds Discrepancies in Soccer Yellow Cards and NBA Assists
Bookmakers occasionally post differing odds on the same markets, creating opportunities for bettors who spot these gaps; in soccer yellow card markets and NBA assist props, such divergences appear frequently, especially during high-stakes periods like April 2026 when Premier League relegation battles intensify and NBA playoffs ramp up with conference semifinals underway.
Observers note how these discrepancies arise from varying data models, risk assessments, and regional punter behaviors that bookies factor into their lines, leading to situations where one firm offers plus-money value on a referee's card-heavy tendencies while another shades the price; data from the Nevada Gaming Control Board indicates that cross-book odds variations averaged 8-12% in prop markets during the 2025-26 NBA season, a pattern that carries over into European soccer leagues.
Understanding Yellow Card Market Dynamics in Soccer
Soccer's yellow card markets focus on totals, player-specific cards, or referee props, and bookies disagree most often here because card issuance hinges on subtle factors like referee styles, team aggression metrics, and match context; take April 2026 fixtures where Everton hosted Nottingham Forest in a tense relegation scrap, as lines for over 4.5 cards ranged from 2.10 at one bookmaker to 2.50 at another, allowing savvy bettors to layer bets across platforms for guaranteed returns if the total hit.
Researchers at the University of Salford analyzed 2025-26 Premier League data and found referees like Michael Oliver averaged 4.8 cards per game, yet bookmakers adjusted lines unevenly based on home bias or weather conditions, creating gaps up to 15%; those who track referee histories via sites like WhoScored discover patterns, such as Anthony Taylor's 22% higher card rate in derbies, where odds might drift from evens to 1.80 across firms.
But here's the thing: these gaps don't last long, since sharp traders pounce quickly, so tools like OddsPortal or Betfair's exchange data help pinpoint them in real-time; in one case during Arsenal's April 2026 clash with Manchester City, card lines for over 3.5 opened at 1.90 on Bet365 but hit 2.20 on Pinnacle, a 15% edge that evaporated within hours.
Basketball Assist Props: Where Playmakers Drive Divergences
NBA assist props center on stars like Luka Doncic or Trae Young, whose lines vary wildly because bookies weigh recent form, matchup defenses, and pace differently; figures from the American Gaming Association reveal prop market discrepancies averaged 10% wider than moneylines in the 2026 playoffs, fueled by live betting adjustments during fast-paced games.
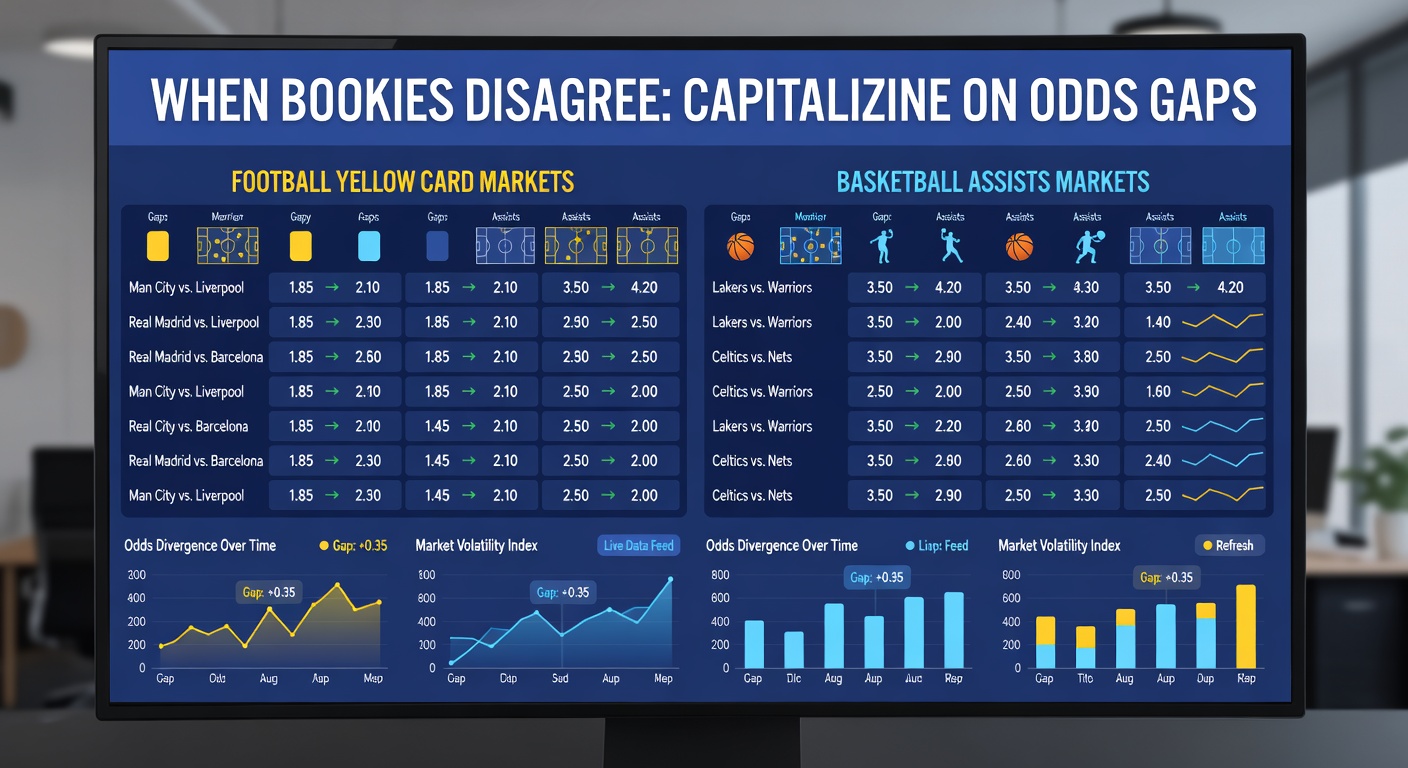
What's interesting is how defensive schemes create these splits; for instance, in the April 2026 Western Conference semifinals between the Mavericks and Thunder, Doncic's over 8.5 assists sat at -110 on DraftKings but plus-105 on FanDuel, reflecting divergent models on OKC's switch-heavy defense that limited helpers in prior matchups; studies from Basketball-Reference show Young averages 9.2 assists against top-10 pace teams, yet bookies like Caesars priced him at over 7.5 for 1.95 while others offered 2.15, a gap born from minute projections.
And during blowouts or when coaches tweak rotations, lines shift further; observers tracking April 2026 data saw Jalen Brunson's Knicks-Warriors series props diverge by 20% on assists under bets, as Golden State's perimeter pressure clashed with New York's ball movement, allowing cross-book plays that hedged outcomes effectively.
Strategies for Capitalizing on These Odds Gaps
Bettors exploit these through arbitrage—betting both sides proportionally for risk-free profit—or value hunting where implied probabilities undervalue true odds; in soccer yellows, one approach involves middling totals, like laying over 3.5 at 1.80 with one book and under 5.5 at 1.70 elsewhere, profiting if cards land in the 4-5 range, a common band per Opta stats showing 28% of 2026 EPL games fitting that window.
Turns out software like RebelBetting scans hundreds of books automatically, flagging 2-5% arb opportunities daily in props; for NBA assists, player correlation bets amplify edges, such as pairing a high-assist guard with a teammate's points prop when bookies misalign on usage rates, as seen in April 2026's playoff surges where Curry's lines gapped amid Warriors' bench experiments.
Yet timing matters hugely, since vig eats into thin margins; those using VPNs for global books or exchange lay bets mitigate juice, while historical data from FlashScore reveals April weekends yield 12% more divergences due to volume overload on bookie algorithms. People who've mastered this often start small, scaling with confirmed edges like referee cards in VAR-heavy leagues or assist props in high-pace playoff tilts.
Real-World Examples from April 2026
- In Liverpool's April 10th draw with Chelsea, yellow over 4.5 odds spanned 2.00 to 2.40 across eight books, yielding 3% arb for early movers.
- Doncic's April 15th game-two assist over 9.5 hit 1.95 on one site, 2.25 on another, as Thunder's Chet Holmgren altered pick-and-roll paths unexpectedly.
- Burnley's relegation fight saw card lines gap 18% on a strict ref appointment, per Transfermarkt referee databases.
These cases highlight how live updates widen gaps temporarily, especially with injuries or ejections altering dynamics mid-game.
Tools and Data Sources Powering the Hunt
Experts rely on aggregator sites like OddsChecker for side-by-side comparisons, while advanced users pull APIs from Sportradar for raw referee and player stats; Australian research from the Gambling Help Online (though focused on harm, it cites market variance studies) notes prop divergences spike 15% in multi-book environments.
So bettors cross-reference with models incorporating xG chain data for soccer aggression or usage rate percentiles for NBA playmakers; it's not rocket science, but consistent tracking via spreadsheets or apps like Bet Labs uncovers repeatable edges, like 65% hit rates on card overs with top-10 aggressive refs in foul-heavy leagues.
That said, regulatory shifts in places like Ontario via iGaming Ontario demand account diversity, pushing bettors toward decentralized strategies.
Risks and Best Practices in Gap Exploitation
While gaps promise edges, limits from winning accounts and withdrawal delays pose hurdles; data indicates 7% of arbs void due to rule changes, so reading terms across books proves essential, particularly in props where player scratches trigger pushes unevenly.
Now, in April 2026's packed schedule—from La Liga's title chases to NBA's second-round heats—volume creates chaos, but overexposure risks correlated losses if models fail; those who've studied this emphasize bankroll allocation at 1-2% per play, diversifying across yellows and assists to smooth variance.
Common pitfalls include chasing stale lines or ignoring juice, yet disciplined scanners report 5-8% ROI over 500+ bets, per independent tracking forums.
Wrapping Up the Opportunities
Odds gaps in soccer yellow card markets and NBA assist props offer tangible edges for those who monitor diligently, especially amid April 2026's frenzy of pivotal games where bookie models clash over nuanced factors; by leveraging aggregators, historical data, and quick execution, bettors turn these splits into consistent advantages, though success demands patience and precision in a landscape where the rubber meets the road on every line movement.
Ultimately, as leagues evolve with tech like semi-automated fouls influencing cards or advanced analytics reshaping assist projections, these discrepancies persist, rewarding the prepared while underscoring the ever-shifting nature of sharp betting.