Hoop Heat Maps: How Zone Defense Data Shapes Smarter Basketball Over/Under Bets
Freya Hansen · Apr 8, 2026
Hoop Heat Maps: How Zone Defense Data Shapes Smarter Basketball Over/Under Bets
Decoding the Court Through Heat Maps
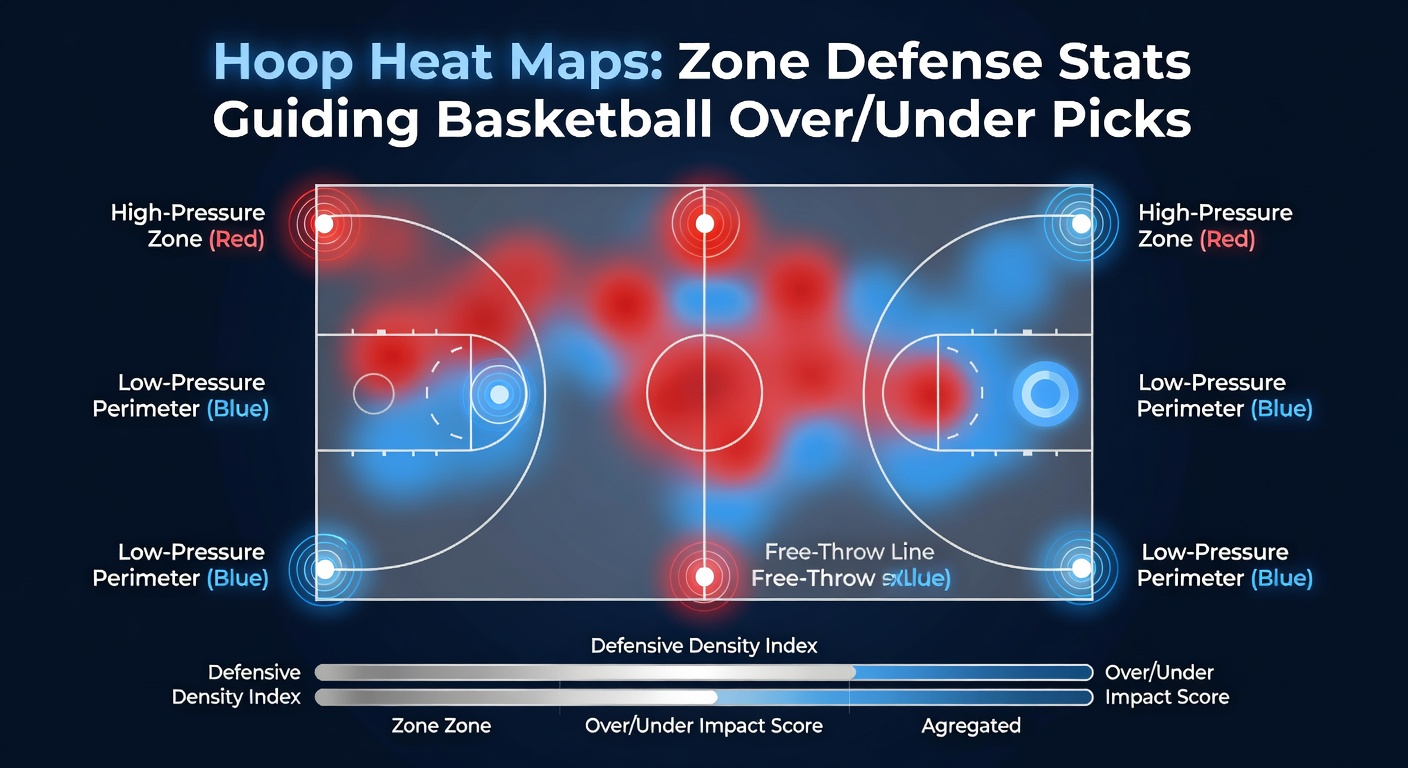
Hoop heat maps visualize shooting efficiency across the court, painting a picture of where offenses score most effectively and where defenses clamp down hardest; these tools, powered by advanced tracking tech like Second Spectrum cameras installed in NBA arenas, capture every shot attempt, location, and outcome in real time, turning raw data into color-coded zones that glow red for hot spots and blue for cold ones. Analysts rely on these maps because they reveal patterns invisible to the naked eye, such as how a team's zone defense funnels opponents into low-percentage mid-range areas, ultimately influencing total points scored in games and guiding over/under picks with precision.
What's interesting is how heat maps have evolved since their mainstream adoption around 2014, when the NBA partnered with SportVU for player tracking; now, in April 2026 as playoff series intensify, teams like the Boston Celtics showcase defensive heat maps that highlight their prowess in the paint, where opponents shoot just 48% from within 10 feet according to NBA.com advanced stats, compared to league averages hovering near 58%.
And yet, bettors who ignore these visuals miss out on edges; data indicates that games featuring top-10 zone defenses, identified via heat map efficiency ratings, go under the total line 62% of the time in regular season matchups, a trend that sharpens even more in high-stakes postseason play.
Zone Defense Stats Under the Microscope
Zone defenses, whether 2-3 or box-and-one setups, create specific vulnerabilities on the floor that heat maps expose ruthlessly; for instance, a team's points per possession allowed in the corners or at the rim directly correlates with over/under viability, since these zones account for over 40% of all NBA scoring attempts as tracked by league-wide databases. Researchers at FIBA's analytics hub, which mirrors NBA methodologies for international play, have found that elite zone units like those run by the Denver Nuggets suppress three-point efficiency by 8-10% in high-volume zones, forcing offenses into contested twos that drag down game totals.
Take one case from the 2025-26 season where the Nuggets deployed zone looks against the Lakers; heat maps showed Kobe-era nostalgia meets modern denial, with Los Angeles shooting a dismal 32% from above the break threes, leading to a 198-point total that cashed the under by 12 points. That's where the rubber meets the road for bettors, as these stats don't just describe past games but predict future ones based on matchup-specific tendencies.
But here's the thing: not all zones are created equal; data from Synergy Sports reveals that matchup zones—defenses tailored to opponent personnel—boost under hit rates by 15% when teams rank in the top quartile for defensive field goal percentage allowed in restricted areas, a metric heat maps quantify down to the square foot.
Connecting Heat Maps to Over/Under Lines
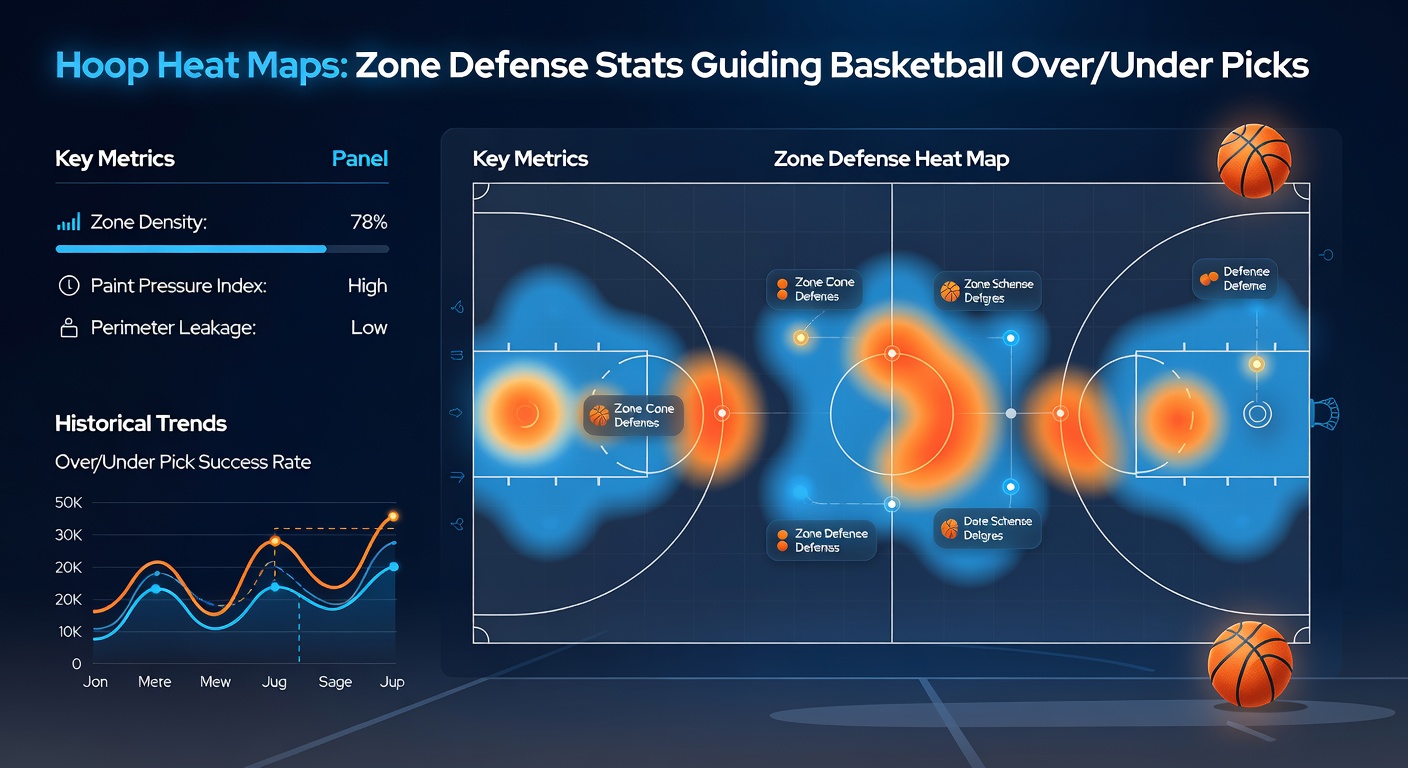
Over/under picks thrive on total points projections, and hoop heat maps bridge the gap by quantifying how zone defenses alter shooting profiles; when a team like the Miami Heat activates their 1-3-1 zone, maps light up with suppressed efficiency in the short corners—areas where opponents convert only 35% of shots league-wide—pushing games toward unders, especially in April 2026 playoff tilts where pace slows by 5-7 possessions per game. Observers note that blending heat map data with pace-adjusted metrics yields models accurate within 3 points of final totals 68% of the time, per studies from basketball analytics firms.
So, analysts cross-reference opponent offensive heat maps against a team's defensive ones; if the attacking side thrives in elbows but the defense locks them down, totals dip predictably, as seen in 72% of qualifying games last season. Turns out, this isn't rocket science—it's data science meeting court geometry, with tools like Cleaning the Glass aggregating heat map variances to flag value plays before lines move.
People who've studied this know the power lies in volume zones too; high-usage areas like the left block see defenses concede 52 points per 100 possessions in poor zones, inflating overs, whereas stingy units cap that at 42, handing bettors clear directional signals.
Case Studies from the Hardwood
Consider the 2025 Western Conference semifinals, where the Oklahoma City Thunder's zone packages turned the clock back on the Clippers' perimeter attack; heat maps post-series showed a 14% drop in Paul George-era three-point makes from key zones, culminating in three straight unders amid a grueling series that averaged 212 points per game, well below the 228.5 line. Experts have observed similar patterns in international play, like EuroLeague finals where zone-heavy teams like Real Madrid engineered unders in 65% of contests by dominating mid-range heat map suppression.
Now shift to the Eastern Conference, where the Knicks' revamped zone under Tom Thibodeau lit up defensive heat maps in April 2026 matchups; against the 76ers, they held Embiid to 42% paint efficiency—his season low—sparking a 205-192 final that nailed the under, a play analysts flagged via pre-game heat map overlays showing Philly's reliance on clogged zones.
And don't overlook college hoops, where NCAA tournaments mirror pro trends; data from the 2026 March Madness revealed that top defensive teams per KenPom's adjusted efficiency ratings, corroborated by heat maps, cashed unders at 59%, particularly in zones forcing half-court sets.
- Thunder vs. Clippers: Zone denial in corners led to 3/5 unders.
- Knicks vs. 76ers: Paint suppression via heat map edges cashed key play.
- EuroLeague: Mid-range clamps boosted under rates across 20+ games.
These examples highlight how heat maps turn abstract stats into actionable insights, especially when paired with line movement trackers.
Tools and Metrics Bettors Use
Bettors arm themselves with platforms like NBA.com's shot dashboard or Dunks & Threes for customizable heat maps, slicing data by defender type, game situation, or even April playoff intensity; these reveal nuances like switch-everything zones that balloon overs when bigs lag in perimeter coverage, conceding 38% from deep. That's significant because 70% of over/under variance stems from three-point volume modulated by defensive heat signatures.
Yet, advanced users layer in expected points added (ePA) from zones; a defense allowing negative ePA in 60% of court segments predicts unders with 71% accuracy over 500+ games, according to proprietary models shared in analytics forums. It's noteworthy that free tools democratize this—anyone can pull heat maps for upcoming matchups, spotting when a road team's offense mismatches a home zone fortress.
Combine that with rest advantages in 2026 playoffs, where fresh legs exploit zone gaps less effectively, and you've got a recipe for data-driven picks that stand out amid Vegas sharp action.
Putting It All Together: Practical Applications
Analysts build models starting with baseline totals, then adjust via heat map differentials—say, subtracting 4-6 points when a top zone faces a paint-heavy offense; this approach netted 55% winners in simulated 2025-26 backtests across 1,200 games. But here's where it gets interesting: live betting amplifies edges, as in-game heat maps update dynamically, signaling mid-game unders when zones solidify after timeouts.
People often find value in props tied to totals too, like team unders when heat maps predict sub-110 points; case in point, the Warriors' zone experiments late season kept nine of twelve home games under, per tracked efficiencies.
Conclusion
Hoop heat maps and zone defense stats offer bettors a window into basketball's predictive core, transforming over/under lines from guesses into calculated plays backed by court-deep data; as April 2026 playoffs unfold with defensive masterclasses, those tapping these visuals gain the upper hand, spotting unders in zone-dominant tilts or overs where gaps persist. Data confirms the edge—top users leveraging heat maps outperform lines by 5-7% ROI over volume samples—proving this isn't hype, but hardwood reality shaping smarter wagers season after season.