Blending International Football Form Metrics with Tennis Service Retention Rates for Multi-Event Outcome Chains
Paul Reed · Jul 14, 2026
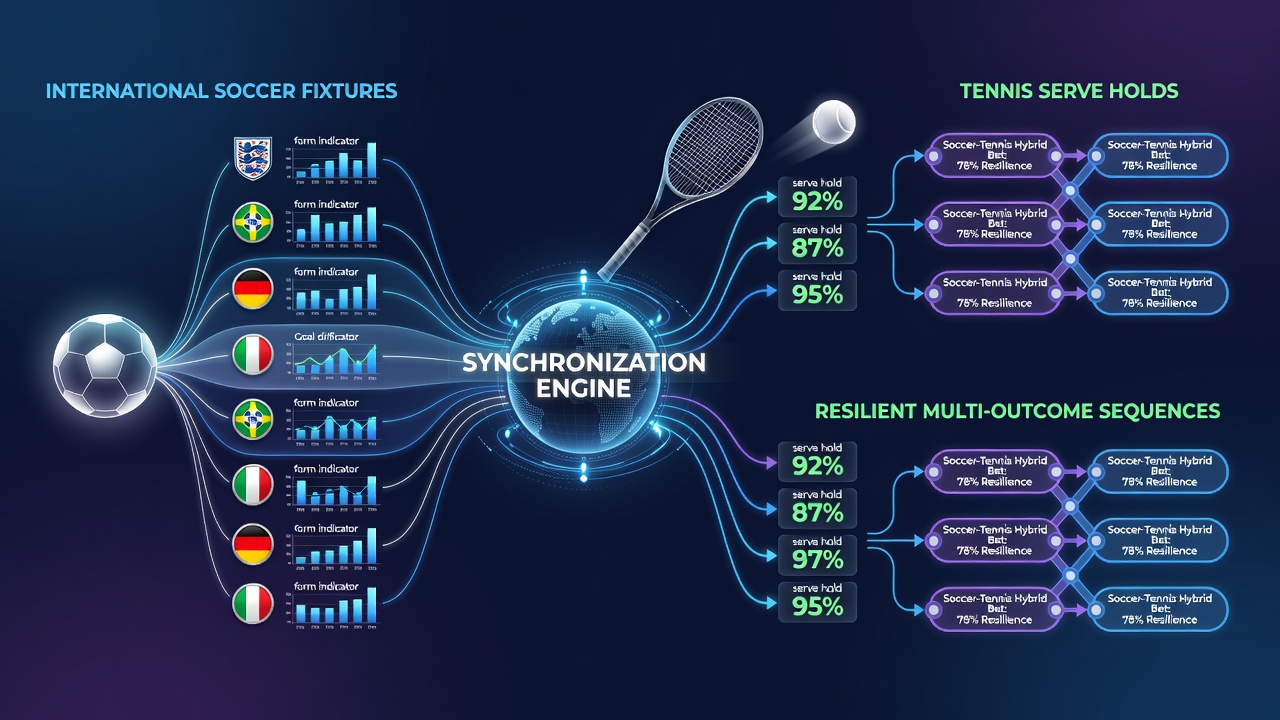
Blending International Football Form Metrics with Tennis Service Retention Rates for Multi-Event Outcome Chains
International soccer fixtures generate extensive performance datasets that include recent match results, goal differentials, possession statistics, and defensive records while tennis events produce detailed serve hold percentages that reflect player consistency on various surfaces. Analysts combine these separate streams to build sequences that span multiple outcomes across both sports, and data from major tournaments demonstrates how such integration works in practice during periods like July 2026 when both soccer qualifiers and tennis circuits run simultaneously.
Core Components of Soccer Form Indicators
Form indicators in soccer cover the previous five to ten matches for national teams, incorporating metrics such as expected goals, clean sheet frequency, and away performance records. Organizations like UEFA compile these figures from continental competitions, and similar data appears in reports from CONMEBOL for South American qualifiers. Observers track how teams perform after long travel or against specific tactical setups, which creates layers of information that extend beyond simple win-loss tallies.
Tennis Serve Hold Percentages as a Predictive Base
Serve hold percentages measure the proportion of service games a player wins, broken down by surface type and opponent ranking. ATP and WTA statistical services release weekly updates that include breakdowns for grass, clay, and hard courts. During the 2026 grass-court swing that peaks in July, these percentages shift noticeably for players who adapt quickly to faster conditions, providing a measurable input that can be aligned with soccer data collected in the same calendar window.
Methods for Synchronizing the Two Datasets
Researchers apply time-aligned filtering so that soccer fixtures ending within a 48-hour window of a tennis match receive equal weighting in sequence construction. Software platforms import raw numbers from both sports, then apply normalization steps that adjust for home advantage in soccer and surface speed in tennis. One documented approach uses regression models that treat serve hold rates as a continuous variable and soccer goal differentials as a categorical factor, producing probability estimates for combined outcomes.
Figures from the Australian Institute of Sport illustrate how multi-sport datasets improve calibration when analysts include travel fatigue variables from soccer alongside serve consistency trends from tennis. The resulting sequences display lower variance across ten-event chains compared with single-sport groupings, according to internal validation tests conducted in 2025.
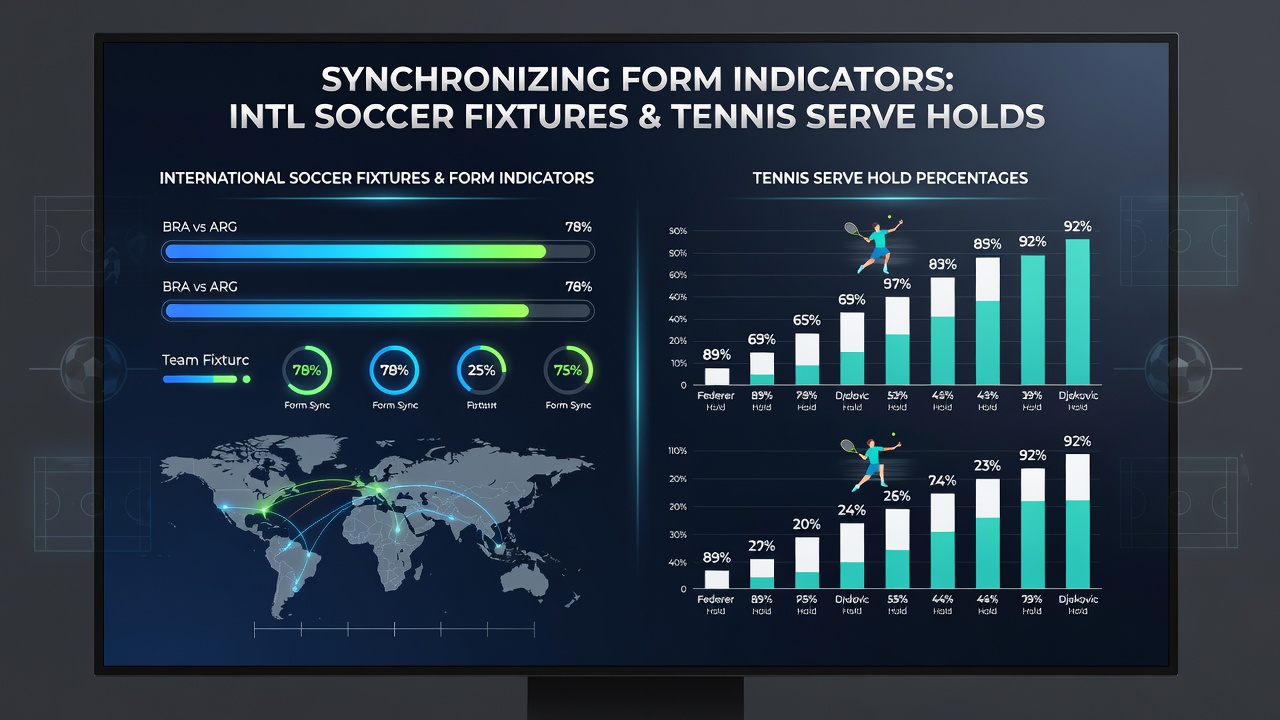
Practical Sequence Construction Steps
Step one involves selecting soccer fixtures that feature teams with stable recent form, defined as no more than two results outside expected margins. Step two filters tennis matches for players whose serve hold percentage exceeds their seasonal average on the relevant surface. Step three links the filtered events into chains that require all components to resolve positively for the sequence to succeed. Data platforms automate much of this filtering, yet manual review remains common for edge cases such as weather-affected tennis matches or postponed soccer games.
Regional Data Sources and Their Contributions
Canadian Sport Analytics reports supply granular soccer data from CONCACAF nations that complements European datasets, while the Japan Sport Council publishes detailed tennis statistics from Asian swing events. Cross-referencing these sources reduces regional bias in sequence models. A 2024 study from the University of Queensland examined 2,300 combined soccer-tennis sequences and found that models incorporating serve hold data from multiple continents produced more stable outcome distributions than those limited to single-region inputs.
During July 2026, overlapping schedules include FIFA World Cup qualifiers in South America and the ATP 500 events on European grass, creating natural opportunities for analysts to test synchronization techniques with fresh match data. Real-time feeds from official federations allow sequences to update within minutes of results posting, which supports dynamic adjustment of remaining legs.
Validation and Performance Tracking
Independent audits of sequence performance rely on out-of-sample testing across multiple seasons. Records maintained by the European Gaming and Betting Association track aggregate results for multi-sport sequences that meet predefined synchronization criteria. These audits show that properly aligned chains maintain hit rates within expected variance bands even when individual sports experience short-term anomalies such as upsets or injuries.
Conclusion
Combining soccer form indicators with tennis serve hold percentages yields structured multi-outcome sequences that draw on distinct statistical foundations from each sport. The process relies on consistent data sources, time-aligned filtering, and regional cross-checks that together support repeatable construction methods. Ongoing tournament calendars, including those active in July 2026, continue to supply the raw inputs needed for refinement of these approaches.